
Web Development
Saket Khare
CTO & Co-Founder

Your website is losing you money right now. Not because of bad design or weak copy, just because it loads too slowly. That’s a harsh way to start a conversation, but it’s the honest one. Most businesses have no idea how much revenue walks out the door every day because a page took three extra seconds to load.
Here’s what the data actually says. Google found that as page load time goes from one second to three seconds, the probability of a bounce increases by 32%. Push that to five seconds and the bounce probability jumps 90%. Akamai research shows that a 100-millisecond delay in load time can reduce conversion rates by 7%. For a business doing $50,000 a month in online revenue, a one-second speed improvement can theoretically return $3,500 every month.
So if you’ve been treating website speed optimization as a technical box to tick, it’s time to reframe it. Speed is a business metric. It affects your Google rankings (Core Web Vitals are a confirmed ranking factor), your conversion rate, your ad spend efficiency, and how your brand is perceived by first-time visitors. This guide covers every meaningful optimization you can make, from the quick wins to the deeper architectural fixes.
Why Your Website Is Slow: The Real Culprits
Before you can fix a slow site, you need to understand what’s making it slow. Most people assume it’s one big thing. Usually it’s a combination of several smaller ones that compound.
The Most Common Speed Killers
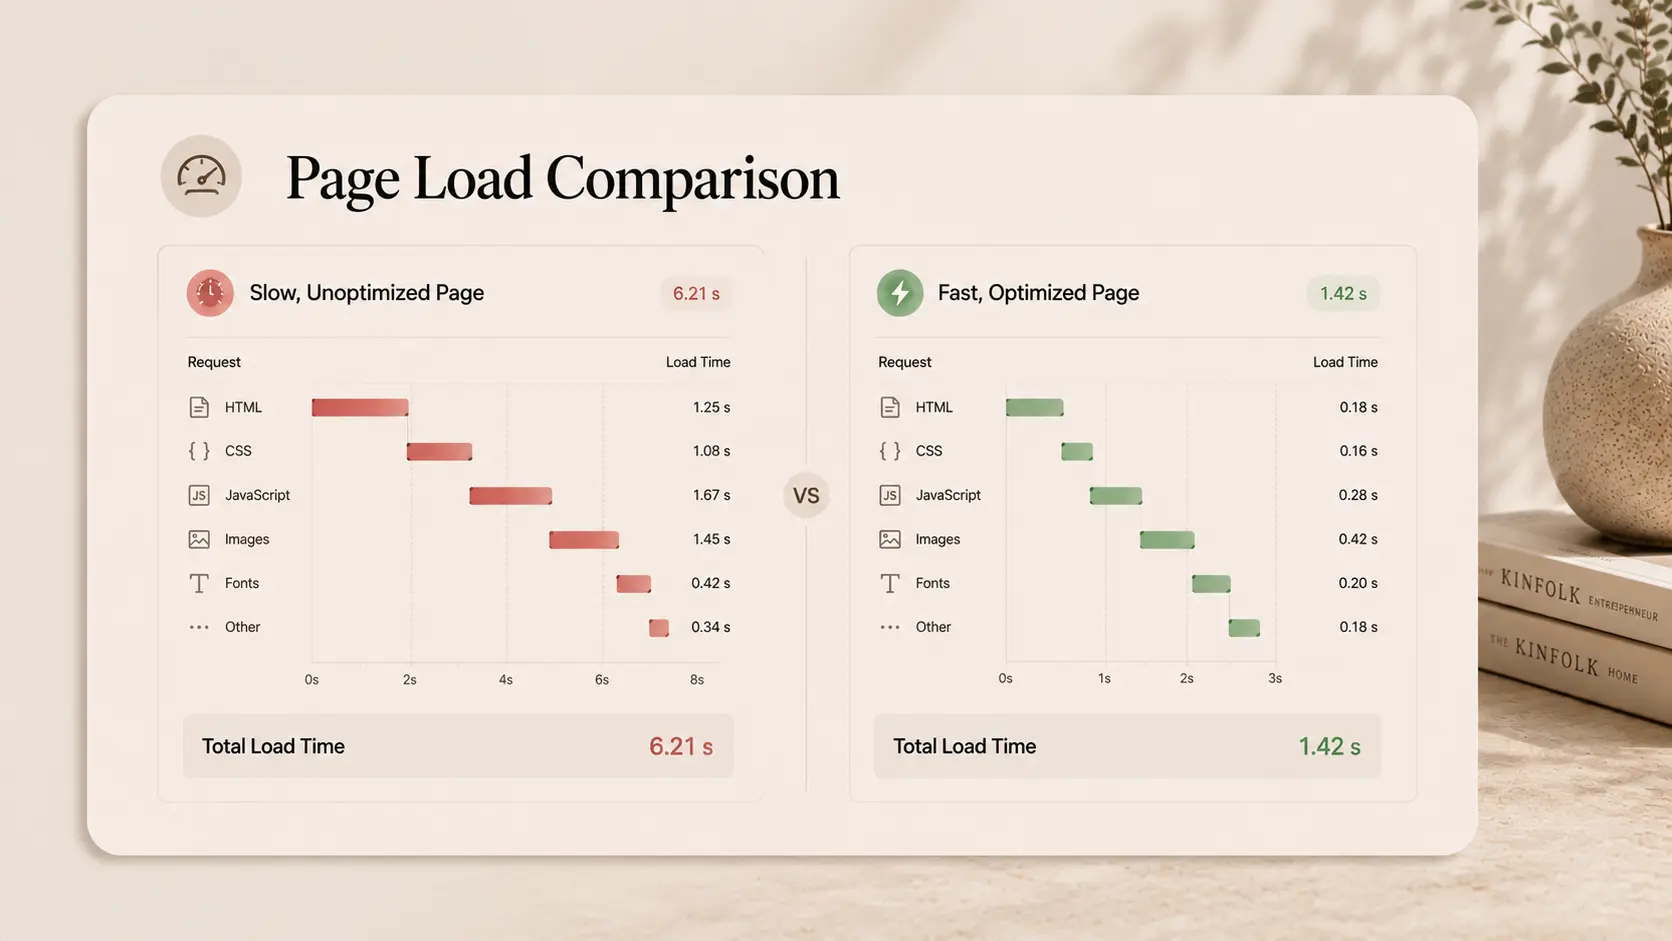
Unoptimised images are the single biggest performance drain on most websites. A homepage hero image saved at 4MB instead of 150KB adds seconds to your load time. Most websites have dozens of oversized images, and most have never been touched since upload.
Render-blocking JavaScript and CSS is the second most common issue. When a browser loads your page, it stops rendering whenever it encounters a JavaScript file that needs to be downloaded and executed first. Third-party scripts, chat widgets, analytics, ad trackers, social media embeds, all contribute to this.
Too many HTTP requests slow things down because every element on a page requires a separate server request. A page with 80 separate requests is slower than one with 25 requests delivering the same content.
No caching means every visitor downloads everything from scratch. With proper browser caching, returning visitors load pages dramatically faster because their browser already has the files.
Slow hosting is the foundation issue. If your server takes 800ms just to respond before delivering any content, you’re starting every page load already behind.
No CDN means your files are served from one location. A visitor in Sydney accessing a server in London waits significantly longer than a visitor in the same country as that server.
How to Measure Your Current Website Speed
You can’t improve what you can’t measure. Before making any changes, get your baseline scores from these tools:
Google PageSpeed Insights, The most important tool. Shows Core Web Vitals scores for both mobile and desktop, with specific issues and recommendations.
GTmetrix, Detailed waterfall analysis showing exactly which elements are slowing your page down and by how much.
WebPageTest, Advanced testing from multiple global locations. Shows exactly how your site loads for visitors in different countries.
Chrome DevTools, Real-time performance analysis in your browser. Network tab shows every request and how long each takes.
What scores should you aim for?
Score Range | PageSpeed Label | What It Means |
90–100 | Good | Where you want to be |
50–89 | Needs Improvement | Losing traffic and conversions |
0–49 | Poor | Significant business impact |
Mobile scores are always lower than desktop and matter more, over 60% of web traffic is mobile. Focus your optimization efforts on mobile performance first.
The Website Performance Optimization Checklist
Let’s go through every meaningful improvement in order of impact. Work through these systematically.
1. Image Optimization (Biggest Impact)
Images typically account for 50–70% of a page’s total file size. This is where most performance gains come from.
What to do:
Convert all images to modern formats. Use WebP for photos, it’s 25–35% smaller than JPEG at the same quality. Use AVIF where browser support allows.
Compress every image before uploading. Tools like Squoosh, TinyPNG, or ImageOptim can reduce file sizes by 60–80% without visible quality loss.
Implement lazy loading. Images below the fold shouldn’t load until a user scrolls toward them. Add loading="lazy" to all img tags below the fold.
Set explicit width and height attributes on all images. This prevents Cumulative Layout Shift (CLS), where content jumps around as images load.
Use responsive images with srcset. Serve different image sizes based on the user’s screen size. A mobile user shouldn’t download a 2000px wide image.
⚡ Expected improvement: 1–3 seconds faster load time for most sites.
2. Fix Render-Blocking Resources
JavaScript and CSS files that block page rendering are a major cause of slow perceived performance.
What to do:
Add defer or async to non-critical JavaScript tags. This tells the browser to continue parsing HTML while the script downloads.
Move non-critical CSS to load asynchronously or inline critical CSS directly in the HTML head.
Audit and remove unused JavaScript and CSS. Run a Coverage audit in Chrome DevTools to see what’s unused.
Delay loading third-party scripts. Chat widgets, analytics, and social media embeds should load after the main content.
⚡ Expected improvement: 0.5–2 seconds improvement in Time to Interactive (TTI).
3. Enable and Configure Caching
Caching stores copies of files so returning visitors don’t re-download everything.
Browser caching: Set Cache-Control headers on your server to tell browsers how long to store static assets. Static assets should be cached for at least a year.
Server-side caching: For WordPress sites, plugins like WP Rocket generate static HTML versions of pages so the server doesn’t process PHP on every request.
Object caching: Redis or Memcached stores database query results in memory, dramatically reducing server response times.
⚡ Expected improvement: 40–60% faster load times for returning visitors.
4. Implement a CDN
A Content Delivery Network distributes your website’s static files across servers around the world. Files are served from the nearest server to each visitor.
CDN | Best For | Pricing |
Cloudflare | Any website, DDoS protection included | Free tier available |
AWS CloudFront | AWS-hosted applications | Pay as you go |
Vercel Edge Network | Next.js and React apps | Included with Vercel |
Fastly | High-performance enterprise sites | Enterprise pricing |
BunnyCDN | Budget-friendly option | From $1/month |
For most websites, Cloudflare’s free tier is sufficient. Setup takes less than an hour and immediately reduces latency for international visitors.
⚡ Expected improvement: 30–70% faster load times for visitors far from your primary server.
5. Optimise Your Server Response Time (TTFB)
Time to First Byte (TTFB) is how long the server takes to respond before delivering any content. It should be under 200ms. Anything above 500ms is a problem.
What to do:
Upgrade your hosting. Cheap shared hosting often causes high TTFB. Move to managed hosting (WP Engine, Kinsta, Cloudways) or a proper cloud provider.
Enable HTTP/2 or HTTP/3. These newer protocols allow multiple requests over a single connection, significantly reducing request overhead.
Use server-side caching to reduce PHP/database processing per request.
Optimise database queries. For content-heavy sites with large databases, slow queries are a major TTFB contributor.
⚡ Expected improvement: 200–600ms reduction in TTFB.
6. Minify CSS, JavaScript, and HTML
Minification removes unnecessary whitespace, comments, and characters from code files. A 50KB JavaScript file can often be reduced to 30KB through minification with no functionality changes.
Most modern build tools (Webpack, Vite, Parcel) handle minification automatically. For WordPress, WP Rocket and Autoptimize handle this without requiring a build pipeline.
⚡ Expected improvement: 10–30% reduction in file sizes.
7. Optimise Web Fonts
Custom fonts add HTTP requests and block text rendering. Poorly implemented fonts cause Flash of Invisible Text (FOIT) or Flash of Unstyled Text (FOUT), both hurt user experience and CLS scores.
What to do:
Use font-display: swap, this tells the browser to show text in a fallback font immediately and swap to the custom font when it loads.
Preload your primary font files in the HTML head.
Limit font variants. Every weight and style is a separate font file. Only load the weights you actually use.
Consider system fonts for body text. System fonts load instantly with zero HTTP requests.
⚡ Expected improvement: 0.2–0.8 seconds improvement in rendering speed.
8. Reduce Third-Party Script Impact
Third-party scripts, analytics, chat, marketing tools, social sharing, ad trackers, are often the most damaging performance elements because you can’t control their servers.
What to do:
Audit every third-party script on your site. Remove any that aren’t actively needed.
Load non-essential scripts after the page has finished rendering using the defer attribute or load on user interaction.
Self-host Google Analytics or switch to a lightweight alternative like Plausible or Fathom to eliminate the external DNS lookup.
Load chat widgets on scroll or click instead of on page load.
⚡ Expected improvement: 0.5–2 seconds improvement depending on number and weight of third-party scripts.
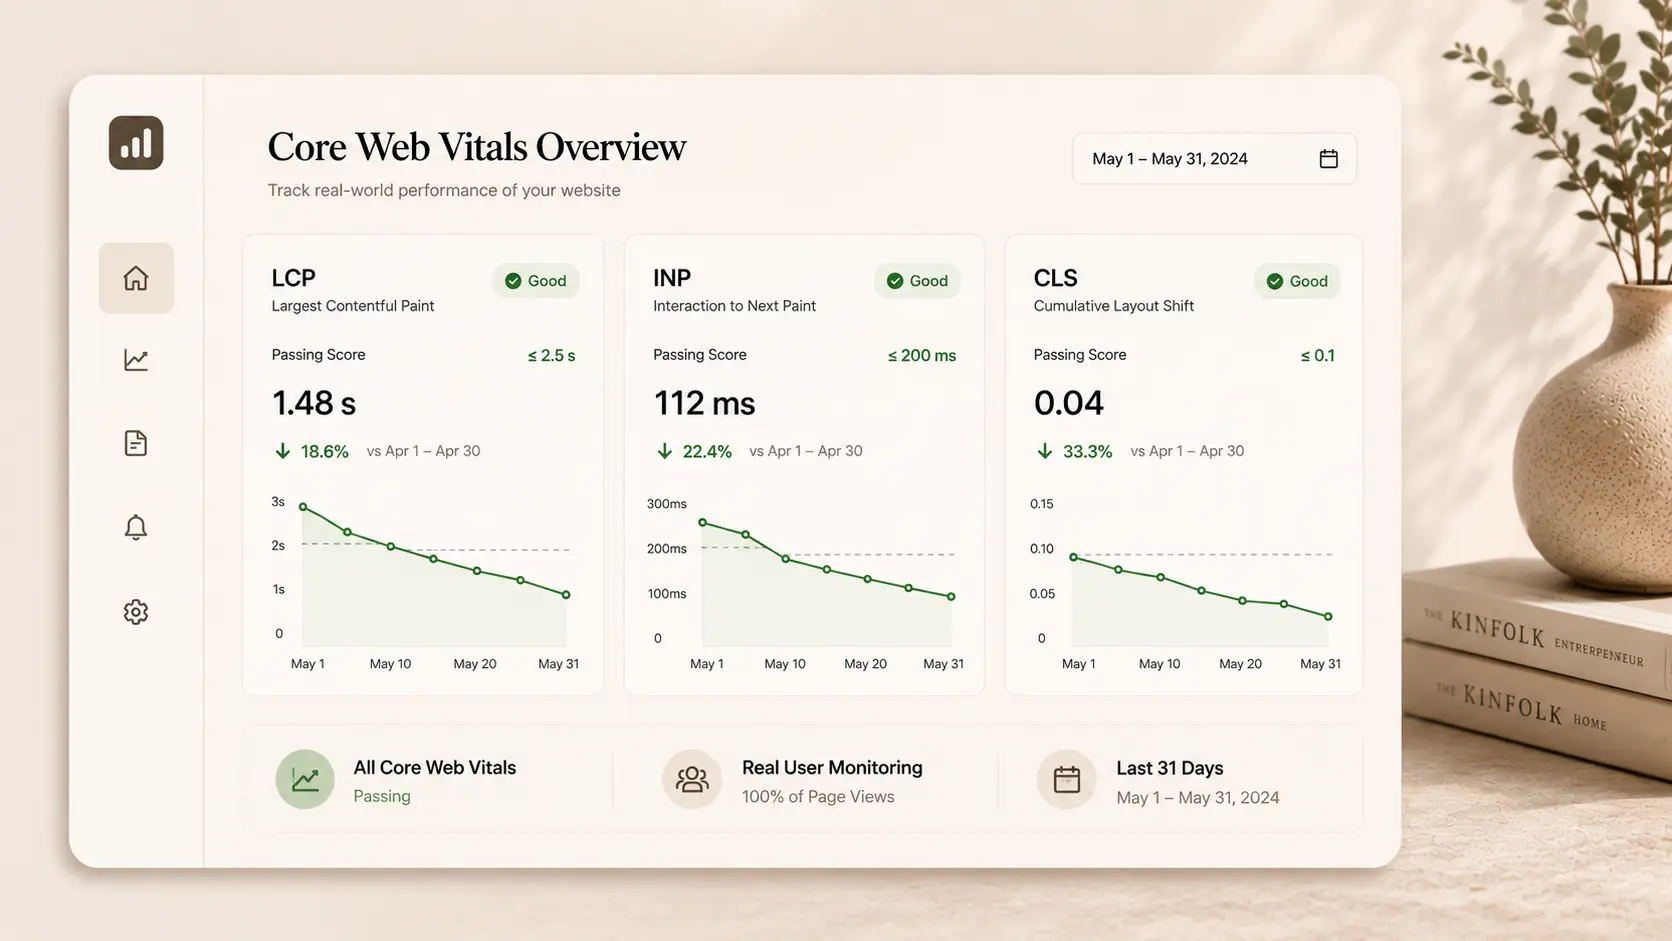
Core Web Vitals: The Three Numbers That Matter Most to Google
Core Web Vitals are Google’s specific page experience metrics. They directly affect search rankings. Here’s what each one means and how to improve it.
Metric | What It Measures | Good Score | Main Fixes |
LCP (Largest Contentful Paint) | How long the main content takes to load | Under 2.5 seconds | Image optimization, faster hosting, CDN |
INP (Interaction to Next Paint) | How fast the page responds to user input | Under 200ms | Reduce JS execution, defer scripts |
CLS (Cumulative Layout Shift) | How much layout shifts while loading | Under 0.1 | Set image dimensions, avoid dynamic content above fold |
LCP is usually the most impactful to fix, and image optimization alone often brings it from 4–6 seconds down to under 2.5 seconds.
WordPress-Specific Speed Fixes
If your site runs on WordPress, some specific optimizations apply:
Use a lightweight theme. GeneratePress, Kadence, and Astra are fast-loading. Avoid page-builder-heavy themes like Divi or Avada unless you know what you’re trading in performance.
Audit your plugins. Every plugin adds code to your site. Run a performance test with each plugin activated and deactivated to identify which have significant impact.
Use WP Rocket. It’s the most comprehensive WordPress performance plugin, handles caching, minification, lazy loading, database cleanup, and CDN integration in one place.
Disable comments if you don’t use them. They add scripts and database queries even when inactive.
Use heartbeat control. WordPress’s heartbeat API makes frequent AJAX calls that waste server resources. Use Heartbeat Control plugin to reduce frequency.
How Createxp Approaches Website Performance Optimization
Performance isn’t a feature Createxp adds at the end of a project, it’s built into how every project is structured from the beginning.
The approach starts before a single page is built. Hosting environment, tech stack, image delivery strategy, CDN configuration, and font loading methodology are all decided at the architecture stage. That’s where performance decisions have the most impact, not after launch when they become expensive retrofits.
Baseline Audit First
Before any work begins, the team runs a full performance audit, PageSpeed scores, Core Web Vitals, GTmetrix waterfall analysis, third-party script audit, image inventory, and hosting assessment. This identifies exactly where time is being lost and prioritises fixes by impact.
Platform-Appropriate Fixes
The optimization approach is different for a Next.js site, a WordPress site, and a custom React app. Createxp doesn’t apply a generic checklist, it applies the right techniques for the specific tech stack.
Mobile-First Performance Targets
Scores are measured on simulated mobile with a 4G connection, the conditions Google uses for rankings. Desktop scores are easy. Mobile scores are where the real work happens.
Post-Launch Verification
Performance is re-measured after launch and again at 30 days. Third-party scripts added after launch, new images uploaded without compression, or new plugins added without review can undo optimization gains quickly. The team monitors for regressions and flags them.
Createxp has taken sites from PageSpeed scores in the 30s to consistent 90+ results, reducing bounce rates, improving search rankings, and in several cases delivering measurable conversion rate improvements from the speed gains alone.
A Fast Website Is a Business Decision Slow sites cost real money. Every second of load time is a percentage of visitors who leave. |
Key Takeaways
A 1-second delay in page load time reduces conversions by up to 7%. Website speed optimization is a direct revenue decision.
Images are the biggest performance drain on most websites. Compress, convert to WebP, and implement lazy loading as your first priority.
Core Web Vitals (LCP, INP, CLS) are confirmed Google ranking factors. Improving them improves both search performance and user experience.
A CDN reduces load times by 30–70% for international visitors and costs very little to implement (Cloudflare’s free tier covers most needs).
TTFB should be under 200ms. If it’s above 500ms, your hosting environment is the likely cause, not your code.
Third-party scripts are often the most damaging performance element. Audit, defer, or remove every one that isn’t earning its place.
For WordPress sites, WP Rocket + a managed host + image compression alone can typically move a site from 40 to 80+ on PageSpeed mobile.
Performance optimization is ongoing. New images, plugins, and scripts added after launch can undo gains quickly. Monitor regularly.
Frequently Asked Questions
How do I check my website speed?
Use Google PageSpeed Insights for the most important score, it uses real-world data and measures Core Web Vitals. GTmetrix gives a detailed waterfall analysis showing which specific elements are causing delays. Run both on your homepage and your most important landing pages.
What is a good website loading speed?
Your Largest Contentful Paint (the time for the main content to appear) should be under 2.5 seconds. Your overall PageSpeed score should be 90 or above on both mobile and desktop. Anything below 50 on mobile means the site is actively losing Google rankings and visitors.
What causes a website to load slowly?
The most common causes are: unoptimised images, render-blocking JavaScript and CSS, too many third-party scripts, no caching configuration, slow hosting (high TTFB), no CDN, and too many HTTP requests. Most slow websites have all of these issues compounding simultaneously.
Does website speed affect SEO?
Yes, directly. Google uses Core Web Vitals as a ranking signal in its Page Experience update. Sites with poor LCP, high CLS, and slow INP scores are disadvantaged in search rankings compared to faster competitors with equivalent content. Speed also indirectly affects SEO through bounce rate, slow sites have higher bounce rates, which signals poor user experience.
How much does website speed optimization cost?
For a WordPress site, the right plugins (WP Rocket at ~$59/year) plus better hosting ($30–$150/month on a managed host) can achieve significant improvements for under $2,000/year. For a professional speed audit and optimization service, costs typically range from $1,500 to $8,000 depending on site complexity. The ROI for most businesses makes this one of the highest-return investments in their digital presence.
What is Time to First Byte (TTFB) and why does it matter?
TTFB is the time between a browser making a request and receiving the first byte of response from the server. It should be under 200ms. High TTFB means every page on your site starts loading slowly, regardless of how well everything else is optimised. It’s almost always caused by slow hosting, lack of server-side caching, or heavy database queries.
What’s the fastest way to improve website speed?
The fastest wins are: compress and convert all images to WebP, enable browser caching, add a CDN (Cloudflare free tier takes an hour to set up), defer render-blocking JavaScript, and upgrade to managed hosting if your TTFB is above 500ms. These five changes alone typically move most sites from below 50 to above 70 on PageSpeed mobile.
Warning: Working With Us May Trigger Unstoppable Momentum